17 Feb
I'm kind of new to this blog, but it has been a pleasure to follow the lead-up to EUREC4A 2020. I have particularly enjoyed watching all these Worldview satellite images, and to learn what gravel, fish and flowers actually mean. These are all beautiful manifestations of spatial organization, as already intensively discussed in previous contributions to this blog. Maybe it is a sign of the times that such mesoscale features of cumulus populations are getting more and more attention. After all, we live in the age of resolution; both in observation (satellites) and simulation (near-global LES) we have seen significant advances in recent decades. Undeniably the added resolution on all fronts is giving us more and more insight into cumulus population statistics.
Cloud Size Distributions (CSD) are one expression of such population behavior. CSDs are interesting for various scientific reasons. One is that the cloud macroscale is relatively easily observable by a wide variety of instrumentation. Just think about the famous Plank 1967 study, https://doi.org/10.1175/1520-0450(1969)008%3C0046:TSDOCC%3E2.0.CO;2 . Second, it has been known for quite some time that many cloud properties do show a dependence (albeit sometimes weak) on cloud size, including cloud number, height, velocity, mass flux, condensate, entrainment, and even nearest neighbor spacing as an expression of spatial organization. This has motivated using the CSD as the foundation for convective parameterization, with the Arakawa-Schubert (1974) scheme arguably being the best known example.
With the advent of the grey zone problem (convection becoming partially resolved) one can no longer assume the CSD to be completely present (or fully sampled) within the GCM gridbox. Pessimists might consider this a parameterization nightmare; surely this destroys the basis of any convection parameterization? On the other hand, optimists might say that this creates new opportunities. For example, when the contribution to convection is known as a function of size, then this is inherently a scale-aware system. In addition, size-filtering can be applied, only maintaining contributions below the grid-filter scale, which makes such schemes scale-adaptive. It is exactly these properties that are required for designing next-generation convection schemes which are seamlessly applicable across a range of scales.
In the past few years I have been exploring this route, reformulating the EDMF approach for subgrid turbulent transport and clouds in terms of the CSD. This yields what I call a "bin-macrophysics" scheme (http://doi.org/10.1002/2015MS000502). In the context of an ongoing ASR project together with Thijs Heus (Cleveland State University) I have recently been using LASSO simulations at the ARM SGP site to investigate some key questions about the CSD. More specifically, we asked what happens to the internal variability of the CSD when the area of analysis becomes too small (like in a GCM gridbox in the grey zone), and how spatial organization in a cloud population acts on top of that. We found strong powerlaw scaling in the internal variability as a function of subdomain size, following an inverse-linear relation. Deviations from this baseline model for sub-sampling reflect spatial organization, yielding a new metric that we call "Borg". It reflects the nearest neighbor spacing between clouds *of equal size*, in that respect differing somewhat from Iorg as recently proposed by Tompkins and Semie (2017). Borg can well be used to represent stochastic effects in CSD-based convection schemes. If you are interested in the details, please see our JAS paper that just came out (https://doi.org/10.1175/JAS-D-18-0194.1).
 Of course an LES is just a model, and we need to repeat our analysis for observed cloud populations. So that is why I am so interested in these high-resolution MODIS images of cumulus populations in the EUREC4A area. How do fish and flowers affect Borg? To find out I downloaded a MODIS reflectance dataset (250 m resolution) for 21 January 2019 and applied our algorithms to extract the CSD. The cloud scene on that day is shown below, featuring a nice east-west chain of cold pools north of Barbados (Figure 1, attached).
 The gridsize of the chunk of data I downloaded was 4800x4800, not unlike a superlarge-domain LES. First thing I did was to extract the CSD for this snapshot (Figure 2), and compare to the CSD as derived from HAMP data from NARVAL2 (Figure 3: thanks Sabrina for sharing this data!).
Encouragingly, despite being derived from different data sources, the CSDs already look pretty similar. A well-defined single powerlaw exists (the dashed line), apparently without a scale break. They even share the same deviation at sizes close to the binwidth. The horizontal dotted lines in the MODIS plot have a special meaning: they indicate the y-axis value of one, two and three clouds. These values only occur rarely, and if so only at the largest cloud sizes (there are only one or two present in this snapshot). As a result, the CSD kind of looks "ragged" in the right tail, which is a sign of "subsampling": the domain size of analysis is still too small to capture the full population. One expects that for a smaller domain size, this effect starts to materialize at smaller cloud sizes. This is related to the nearest neighbor spacing increasing with cloud size (Joseph and Cahalan, 1989). We quantified this effect by means of a subdomain analysis. To this purpose I cut up the big MODIS domain into first 4 equally sized subdomains, then 16, 64 and finally 256. In each the CSD is calculated. Across all subdomains one expects some variation in the number N of clouds of a given size l; this spread is calculated as a simple standard deviation sigma. We call this spread the "internal variability of the CSD".
 Figure 4 shows sigma normalized by N as a function of subdomain size L (the full domain has L=1200 km). At large cloud sizes a powerlaw scaling is evident, with an exponent -1 that reflects an inverse linear dependence on subdomain size L. In other words, the larger the subdomain, the better sampled the cloud number is, and the lower its internal spread. We call this behavior the "baseline" model for exclusively subsampling. In contrast, for the smallest clouds the powerlaw exponent is much closer to zero. This means that their variability does not reduce that much with subdomain size. What this reflects is spatial organization; the smallest clouds "live" on top of larger-scale thermodynamic structures such as cold pools, which favor or inhibit their formation, and thus boost their variability beyond the baseline model.
Note that the results are pretty well stratified for cloud size; the number of larger clouds is more variable for a given subdomain size, which again reflects the larger spacing between them. This motivates normalizing L by l, as shown in Figure 5. This yields a data collapse for clouds larger than 5km. The dotted line is the baseline model with exponent -1, for reference. The departure of the exponent from this baseline model is what we call Borg. It highlights that the impact of spatial organization on the CSD is strongest for the smallest clouds.
To summarize, what these results suggest is that variability in cloud number is predictable, and reflects both subsampling effects and spatial organization. What I find pretty cool is that MODIS thus seems to confirm our analysis based on LES, and suggests that this behavior is pretty general. So maybe there is still hope in cumulus parameterization! Inspired by these results we are currently building a stochastic module for our EDMF. And guess what: in theory Borg could be assimilated, from daily observations like MODIS.
Cheers from a sunny Cologne (17 degrees in February! But not quite Barbados yet)
Roel
Bjorn mentioned it already a few times; we are planning to deploy our C-band (wavelength 5.5 cm) Poldirad weather radar during Eurec4a on Barbados. Even though Poldirad is quite old now and was one of the first polarimetric weather radars in Europe, it still has some advantages over operational weather radar systems. We are fully flexible in scanning and in the way we can polarize the radar pulse and analyze the polarization of the backscatter signal.
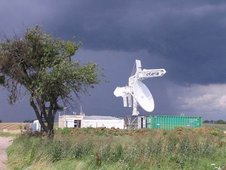
The radar has a 4.5 m dish and we need four 20ft containers for the transport (Fig.1 shows our installation during COPS in France). So, it will be a major installation and with the efforts of site preparing, transportation costs and so on, our plans are to stay longer than the four weeks in January/February 2020. Currently we plan to start measurements in December 2019 and run the radar into the transition to the wet season (June 2020). Unfortunately, the radar is not designed for remote control and some of us have to stay with the radar for that period.
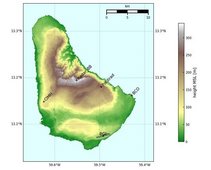
I did spend some time on the Island driving around and searching for a location with a good view to the East, less sea spray and wind than at BCO, a 3-phase power line nearby, accessibility for trucks and crane, and … Finally, with the help of David, Marvin, Friedel, and Lutz we agreed on a good location (c.f. Fig. 2) near St. John church (by the way, a nice location with a wonderful view to the East coast). This location is about 240 m above sea level and we will have an undisturbed view to the East and South and some limited view to the North and West.
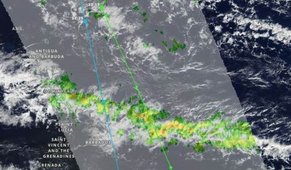
What will be our plan for the measurements? Certainly a C-band weather radar does not see most of the water clouds, our focus will be on precipitation cells like those we expect to observe within the “Fish” and “Flower” cloud structures. Figure 3 shows the well-known MODIS images of the fish on Jan 26th, 2019 plus the corresponding GPM precipitation (note that there is a 5 hours offset). There are two questions we want to investigate within Eurec4a:
- what is the life cycle of the precipitation cells approaching Barbados and in particular those passing over BCO? We already had the discussion about diurnal cycle, we hope that we can contribute to this topic as well.
- the other point is related to our IcePolCKa project within the DFG-SPP PROM: what information can we retrieve about cloud microphysics when combining our C-band measurements with the profiles from the Ka- and W-band radars at BCO? Florian will give you some more information about this.
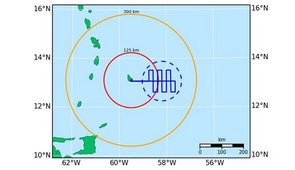
Our measurement strategy will be horizontal PPI-scans up to a range of 200 or 300 km to study the life cycle of precipitation cells east of Barbados (Fig. 4). And then we will perform vertical cross-sections (RHI-scans) towards BCO (8 km distance) and fan-like RHIs further to the east to catch the cells before they pass over BCO. We think, we can achieve a 5 to 10 minutes update cycle.
Yes, there is another weather radar at Barbados (Radar_BB on Fig. 2). This radar is a S-band system (wavelength 10 cm), the radar is located next to Hunte’s Garden (another nice place on the Island). Unfortunately the radar is out of order since some time; I’m trying to get more information from the manufacturer. This radar has a 5 times higher transmit power and is a few dB more sensitive than Poldirad. However, Poldirad allows for a more flexible scan strategy and offers dual-polarization identification of hydrometeors.


