19 Feb
Last November, 67 of you at MPI and LMD sat down for a day and drew more than 50,000 boxes around Sugar, Flower, Fish and Gravel. Here, I want to show you that your efforts were well worth the time. But let’s backtrack a little for all those who were not involved.
Over the last weeks we have heard a lot about different cloud patterns. Flowers, for example, have captured our imagination time and time again. As scientists, however, we are interested in these patterns not (only) for aesthetic reasons. Rather we want to know why these patterns occur and how they (and their precious albedo) might change in a warming climate. Unfortunately, as with anything cloud-related, understanding doesn’t come easily.
Out of this frustration a more data-driven approach was born: What if we identified thousands of commonly occurring cloud patterns? Could we learn something from the shear mass of data? Sounds interesting, but where to get the data from?
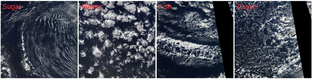
“No problem”, said Bjorn (I am putting words into his mouth here), “I will just make my entire department do nothing else for an entire day.” And so it began. We set up a labeling interface where users were asked to draw boxes around four common cloud patterns: Sugar, Flowers, Fish and Gravel (see Fig 1).
On Nov 2 at MPI and Nov 29 at LMD, 67 scientists embarked on an exhilarating day of classifying satellite images. We picked 10,000 images from three regions, one of them located just East of the BCO. In total we managed to classify each image 3 times on average, leading to a total amount of classification of over 30,000 (see examples in Fig 2 on the left). Now that’s what I call an awesome dataset!
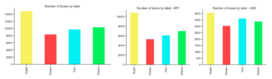
First up some basic statistics. Sugar was the most common category, while flowers were the rarest pattern (Fig 3). Interestingly, the distributions were different at MPI and LMD. Any idea why? I have no clue. On average, classifying a single image took just under 30 seconds and the mean number of boxes per image per user is 1.6.
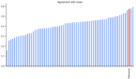
One of the first questions we can ask is whether the users actually agreed on the cloud patterns. For this I came up with the following metric: “In which percentage of cases, if one user drew a box for one category, did another user also draw a box of that category under the condition that these boxes overlap at least a little.” Overall the agreement is around 43%. So, it’s definitely not random but there is a considerable amount of uncertainty. The agreement also differs by cloud pattern. Flowers were easiest to identify with over 50% agreement while fish turned out to be controversial with only 37% agreement.
There is plenty more information is these classifications. Hauke, for example, looked at how the environmental conditions differ for the four patterns but I am sure he will be happy to tell you more at UCP.
For now though, let’s turn our attention to machine learning, which was one major motivation for this project. Machine learning algorithms, specifically modern deep neural networks excel at detecting patterns in images, once they have been trained on large datasets. For this project, I trained an object detection algorithm, called Retinanet, using the classifications from two of the three geographical regions. In Fig 2 on the right you can see the algorithm’s predictions for the region not used during training alongside the human classifications for the same image. As you can see the predictions look quite good. For some images, we might not agree with our neural network, but remember that humans also disagree quite frequently.
We can now also use our agreement metric from above to check how much the algorithm agrees with all the other human labels. The result is around 57% (Fig. 4) compared to the 47% for the inter-human agreement for these validation images. Funnily enough, the deep learning model agreed least with humans on flowers. Maybe recognizing the beauty of flowers is an inherently human trait?
So now we have an algorithm that classifies images on a human level. What can we do with that? Here I will end with a cliffhanger and tease you with the attached GIF. For an explanation and much more you will have to wait for my talk at UCP on Monday afternoon.
Finally, I would like to thank all participants very much for their effort. Specifically, Hauke Schulz has been a tremendous help organizing the classification days and analyzing the data. I think that aside from the scientific knowledge we will gain from the data that we already have, this project pioneers a new way of discovery using the power of crowdsourcing and deep learning.
I am very interested to hear your feedback and ideas on how we can use this dataset, but also which other research questions we could tackle with similar approach.
Best,
Stephan
PS: If you want to try labeling some clouds, check out the Zooniverse project: https://www.zooniverse.org/projects/raspstephan/sugar-flower-fish-or-gravel
PPS: All the data, code, etc are available here: https://github.com/raspstephan/sugar-flower-fish-or-gravel