2 Feb
In the context of flowers, it would be interesting to retrieve the cloud droplet size as an interesting quantity to illuminate the mechanisms behind these very thin stratiform layers.
Hauke, Bjorn: thanks for asking! I couldn’t agree more. Yet it is so difficult.
Day 14, two weeks into the campaign. The initial enthusiasm starts deteriorating (excepting Björn of course). Cabin fever starts creeping in … you know this feeling? You start developing second thoughts about your beloved instrument: Lidar — such a sensitive instrument, yet fails to penetrate into the clouds. The Microwave Radiometer — perfect for measuring LWP. Yet, sawtooth patterns all over the place! Radar — providing vertical profiles. In principle yes, but not for those darn small droplets. SMART — passive and robust. But blind to what’s going on to the left and right of the flight track. Last but not least specMACS — high-resolution imaging beauty. Yet constantly fighting with 3D effects. So sad :-(
Such thoughts are perfectly normal after two weeks campaign. It is time to remind you about the GLORY of remote sensing. The glory? Sit back and enjoy my small explanatory video https://www.dropbox.com/s/l3hxpvk3l32oy1y/GloryDays.m4v?dl=0
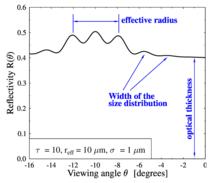
I already talked about the glory in Pre-Pre-EUREC4A. If you still haven’t seen one, watch out for the aircraft’s shadow once you break through the clouds during takeoff. Or even better, climb a high enough mountain on an overcast day. As a quick reminder: The backscatter glory is a diffraction feature in the scattering phase function of liquid droplets. As such, the angular width of the circles is a direct measure of the droplet size: The larger the glory, the smaller the droplet. Did you note the changing diameter of the glory in the aircraft images? This has nothing to do with the distance to the cloud but is a pure indication of variable droplet size. Since we can precisely calculate the scattering phase function of droplets using 110 years old Mie theory, we can use images of the glory to derive droplet size very accurately. On top of that, the glory also contains information about the droplet size distribution: Wider size distributions cause more washed-out features. And — in contrast to all other optical remote sensing techniques — it is not affected by 3D radiative transfer effects. For more information see Figure 1 below, and my 2004 paper, https://www.atmos-chem-phys.net/4/1255/2004/
In the meantime I was lucky to find a very good student, Veronika Pörtge, to work on that subject. Veronika started using NARVAL-II data with the aim to develop an automated droplet size retrieval which would involve 3 steps:
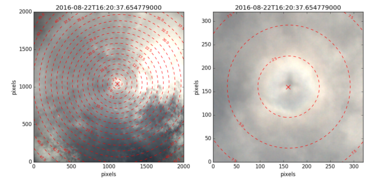
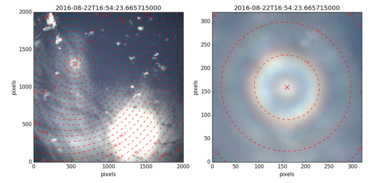
Step 1 is to identify the glory in each of the 360,000 images taken during the NARVAL-II campaign. This could be either done by hiring 10 students for 100 hours each, assuming that it takes about 10 seconds per picture to mark the exact position of the glory manually. Or (more clever), to use aircraft location and orientation data to automatically calculate the location of the glory. And it turns out that the available aircraft information is highly accurate, see 2nd Figure (left: larger area, right: zoom). The cross marks the calculated location of the glory which coincides nicely with the clearly visible aircraft shadow (as it should), indicating that specMACS was mounted behind HALO's wings in the „boiler room“. If you ever forgot where you mounted your camera, this would be the way to figure it out ;-) The circles indicate angles of 2.5 and 5 degrees.The glory in this case has a radius of about 2.5°. The 3rd figure shows a better example of a glory which might seem familiar to you. It’s one of those in the video above. No shadow visible, since we are too far above the cloud in this case.
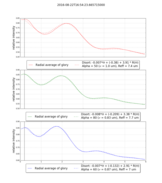
2nd step is to measure the width of the glory. Depending on the homogeneity of the scene one may average over either the full circle or over angular segments to reduce noise. Figure 4 shows an average over the full 360° (solid line) for the glory in the previous figure. Rather than simply measuring the radius of the ring, we fit simulated (libRadtran/MYSTIC) glories to the data (dashed line). From the three fits to the red, green, and blue camera channels we find that we can explain the observations with droplet radii of 7.0 … 7.7 micron, with a width of the size distribution of 0.83 … 1.0 micron. Isn’t that great information?
The 3rd step is to identify what we are actually looking at. Merging the derived radius information with Tobi Kölling’s cloud shape retrieval from specMACS should provide a high-resolution spatial distribution of droplet radius at the outer boundary of the cloud along the track of the glory.
Veronika will finish her master thesis before EUREC4A and we hope to have a working retrieval by then, which might even combine information from subsequent images in order to observe the same point on the cloud from different angles. Once we have more NARVAL-II results, they will be posted on the specMACS server, https://macsserver.physik.uni-muenchen.de/campaigns/NARVAL-II/
And we plan to improve the instrument. Most important, the current camera was actually never meant to provide quantitative information, but only as a supplement to the two spectral cameras of specMACS. It will be replaced by a better system with a larger field of view and including polarization. The latter should not only improve the contrast of the backscatter glory but also allow utilizing the cloudbow which provides similar information but at a different location, implying better coverage. Both glory and cloudbow provide droplet size and variability close to the cloud edge. Combined with more „traditional“ Nakajima&King-type remote sensing using the spectral cameras of specMACS we hope to get deeper insights into droplet size profiles and entrainment which is an important step towards quantifying droplet number density and learning more about cloud-aerosol-interaction.
It’s so much fun to look at these nice images and to even derive quantitative information from them :-)
Best wishes,
Bernhard Mayer and Veronika Pörtge.